The AS/ITS PMOs use the following tools for creating analysis diagrams:
| Technique | Required? | Definition (from Wikipedia) | Class and Web Sources | Stanford Examples |
|---|---|---|---|---|
| Context Diagram | Required | A system context diagram (SCD) in software engineering and systems engineering is a diagram that defines the boundary between the system, or part of a system, and its environment, showing the entities that interact with it. This diagram is a high level view of a system. It is similar to a block diagram. | 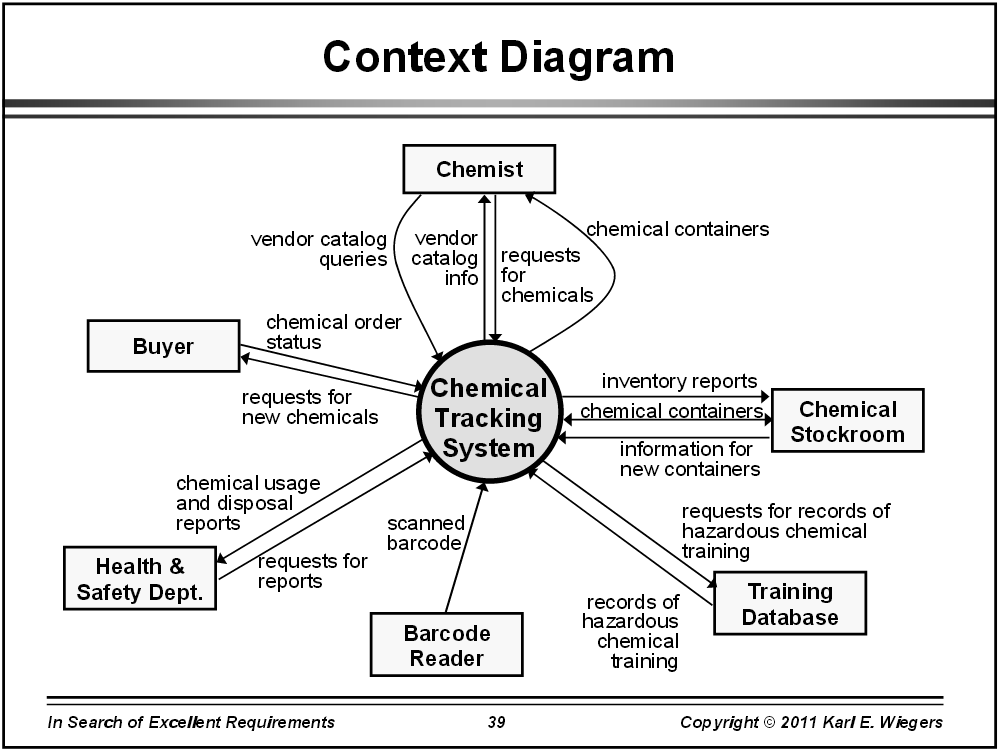 Wikipedia: System Context Diagram (external link) |
   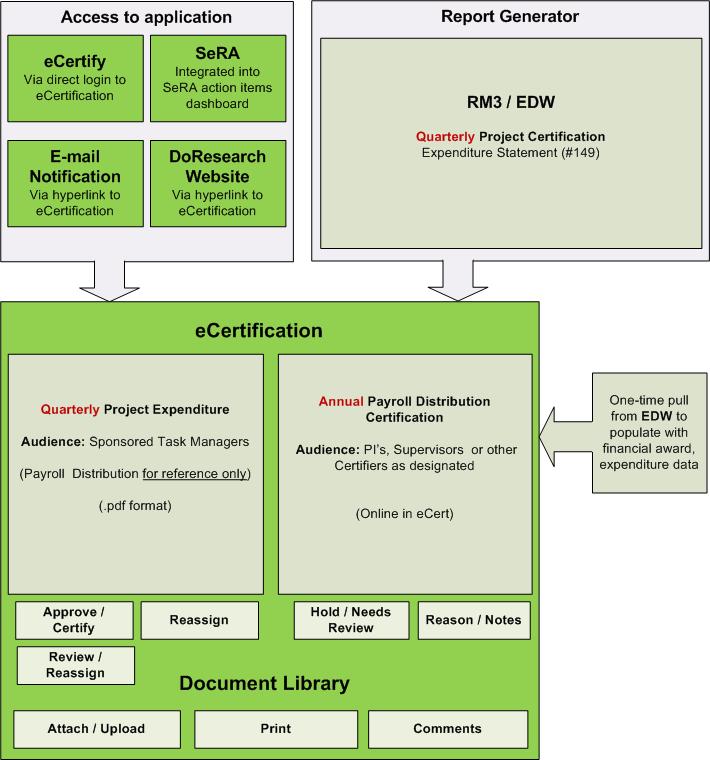  |
| Data Flow Diagram | Strongly Recommended | A data flow diagram (DFD) is a graphical representation of the "flow" of data through an information system, modeling its process aspects. Often they are a preliminary step used to create an overview of the system which can later be elaborated. DFDs can also be used for the visualization of data processing (structured design). A DFD shows what kinds of information will be input to and output from the system, where the data will come from and go to, and where the data will be stored. It does not show information about the timing of processes, or information about whether processes will operate in sequence or in parallel. | 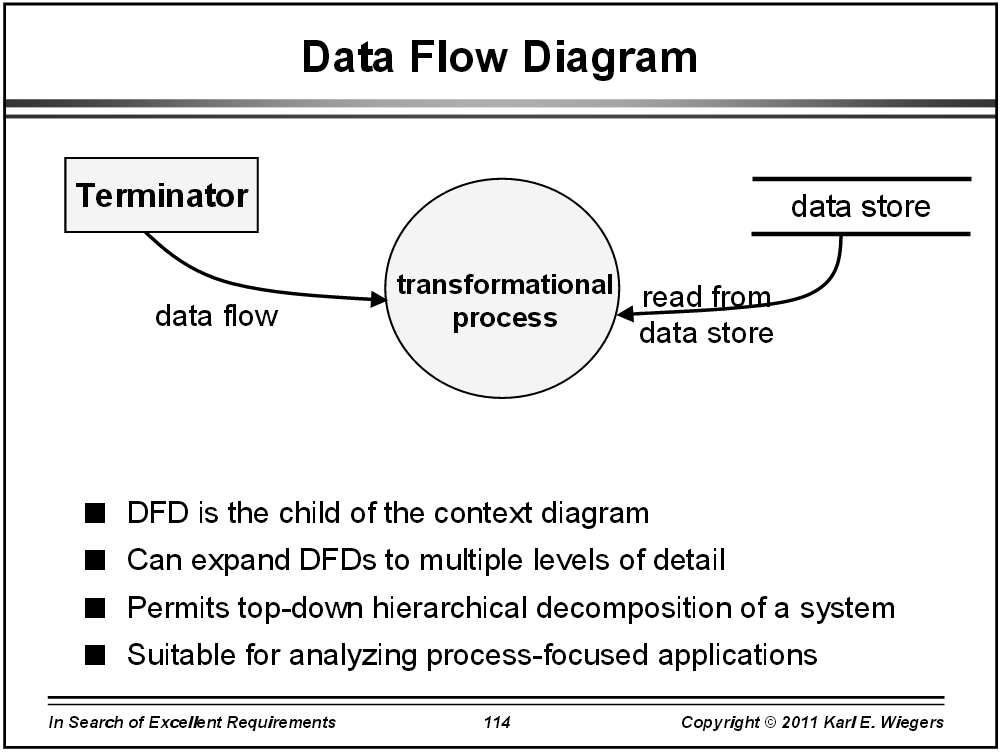 Wikipedia: Data Flow Diagram (external link) |
School of Medicine Data Warehouse Data Flow Diagram Example Middleware and Integration Services Data Flow Diagram Examples |
| Mock-ups, Wireframes, and Prototypes | Strongly Recommended |
A prototype is an early sample, model, or release of a product built to test a concept or process or to act as a thing to be replicated or learned from. It is a term used in a variety of contexts, including semantics, design. electronics, and software programming. A prototype is designed to test a new design to enhance precision by system analysts and users. Prototyping serves to provide specification for a real, working system rather than a theoretical one. A website wireframe, also known as a page schematic or screen blueprint, is a visual guide that represents the skeletal framework of a website. Wireframes are created for the purpose of arranging elements to best accomplish a particular purpose. The purpose is usually informed by a business objective and a creative idea. The wireframe depicts the page layout or arrangement of the website's content, including interface elements and navigational systems, and how they work together. The wireframe usually lacks typographic style, color, or graphics, since the main focus lies in functionality, behavior, and priority of content. In other words, it focuses on what a screen does, not what it looks like. Wireframes can be pencil drawings or sketches on a whiteboard, or they can be produced by means of a broad array of software applications. Wireframes are generally created by business analysts, user experience designers, developers, visual designers and other roles with expertise in interaction design, information architecture and user research. |
 Wikipedia: Wireframes (external link) |
Axess Wireframe Examples |
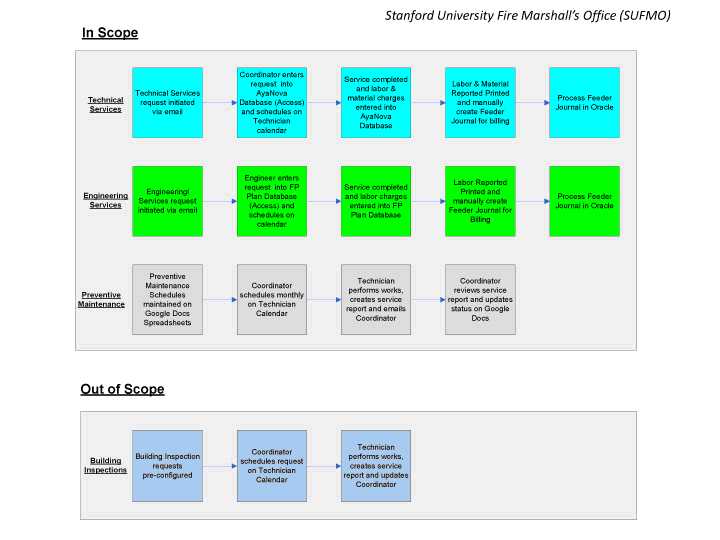
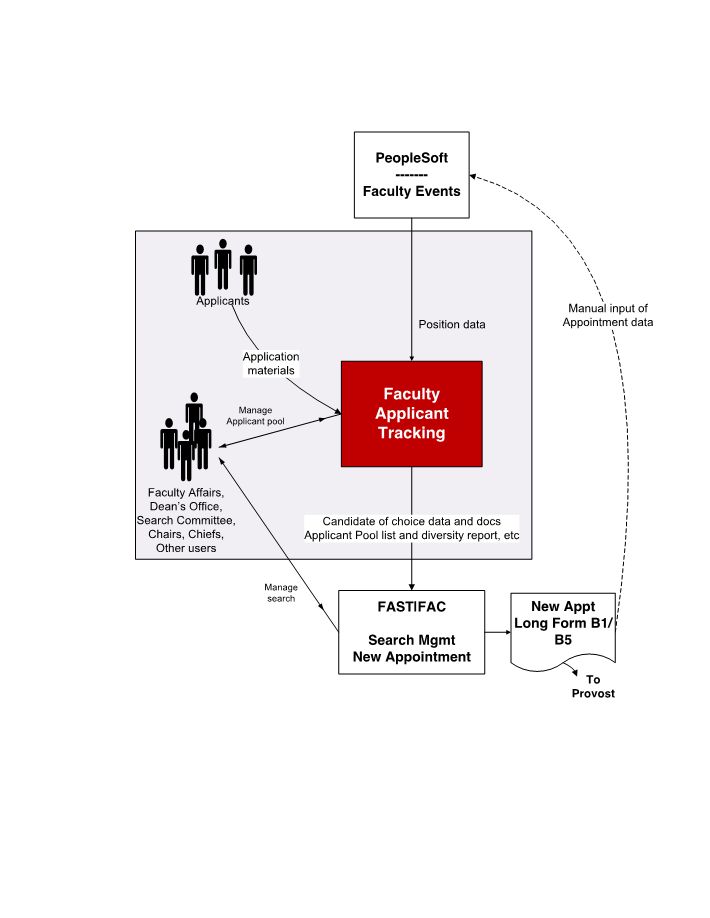
| Activity Diagram | Strongly Recommended | Activity diagrams are graphical representations of workflows of stepwise activities and actions with support for choice, iteration, and concurrency. In the Unified Modeling Language, activity diagrams are intended to model both computational and organizational processes (i.e. workflows). Activity diagrams show the overall flow of control. | Wikipedia: Process Modeling (external link) | New Faculty Appointment Activity Diagram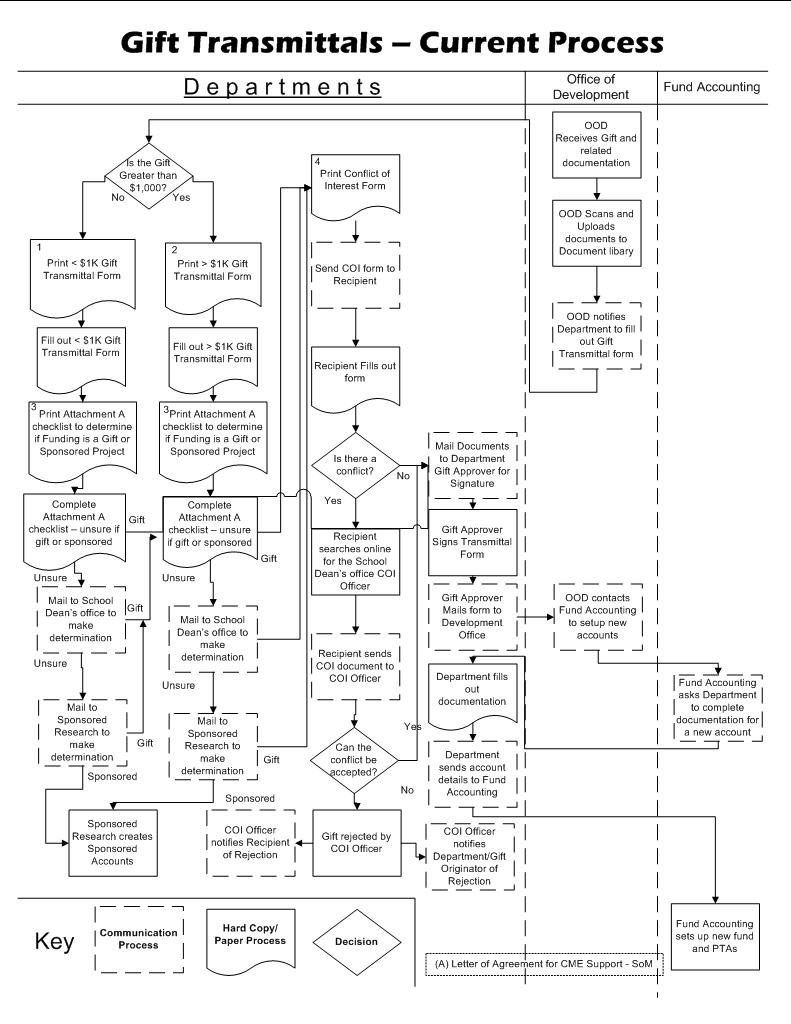 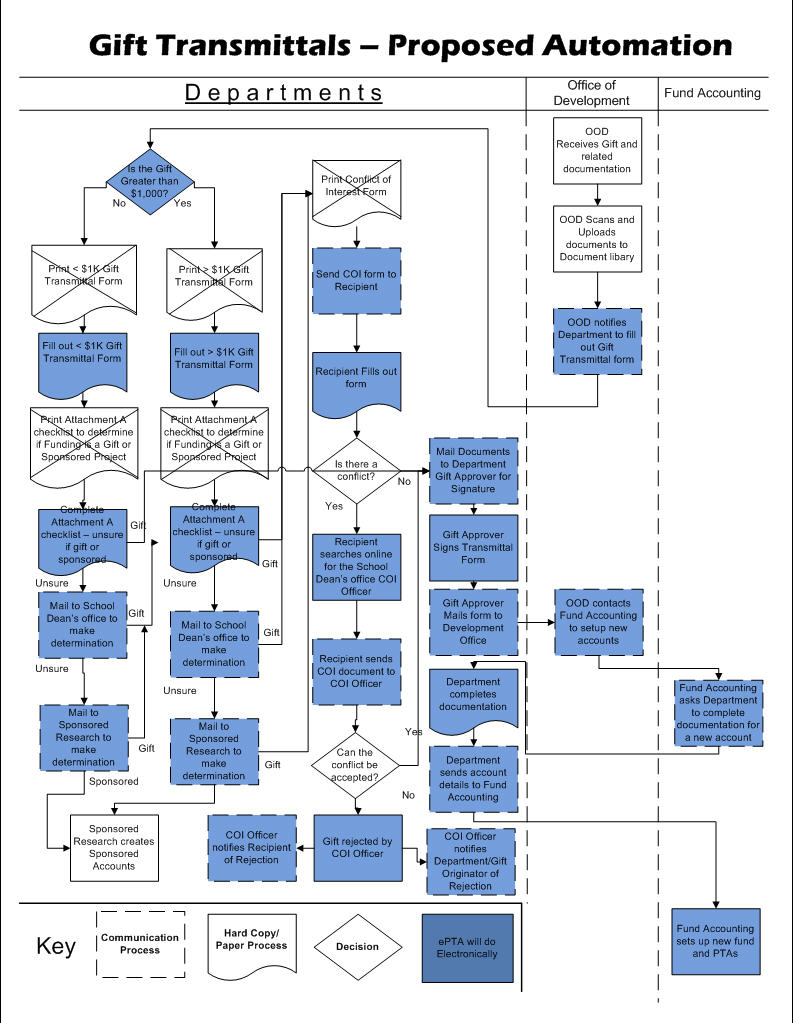 |
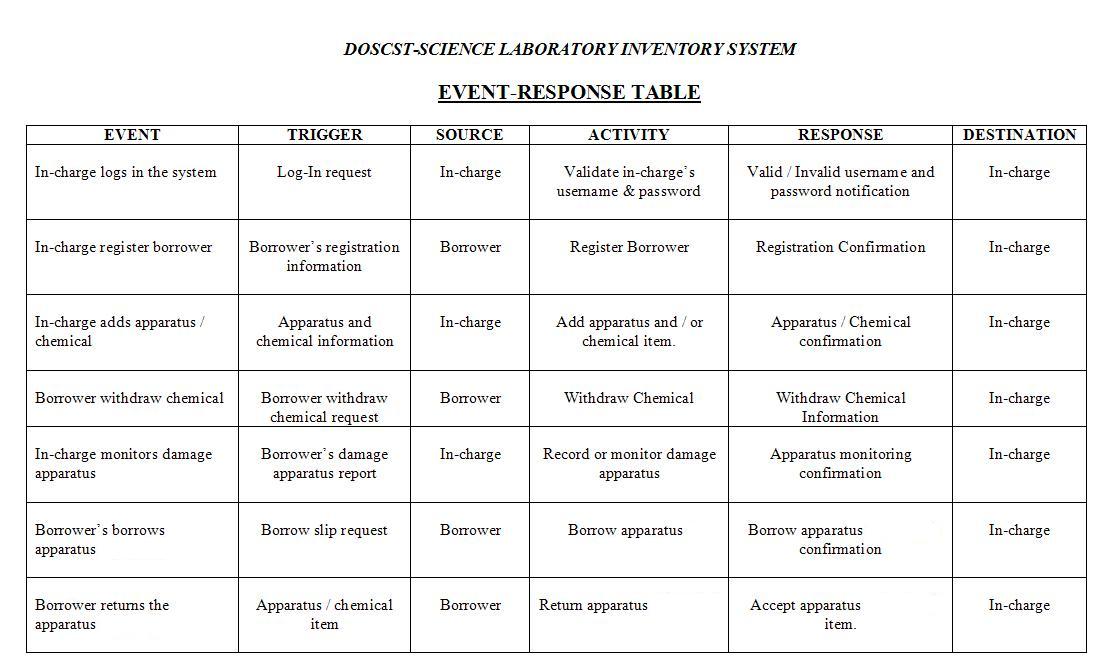
| Event Response Table | Use at your discretion | Event partitioning, illustrated using Event Response tables, is an easy-to-apply systems analysis technique that helps the analyst organize requirements for a large system into a collection of smaller, simpler, minimally-connected, easier-to-understand use cases. | 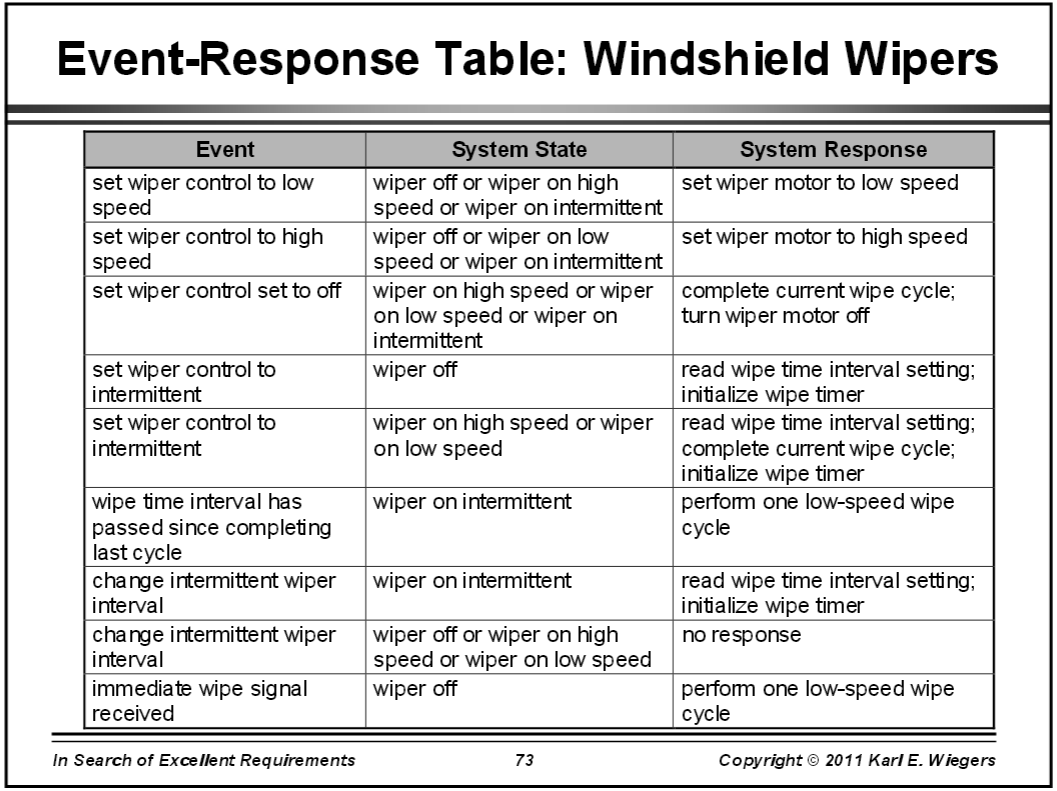 "When Use Cases Aren't Enough" Wikipedia: Event Partitioning (external link) |
 |
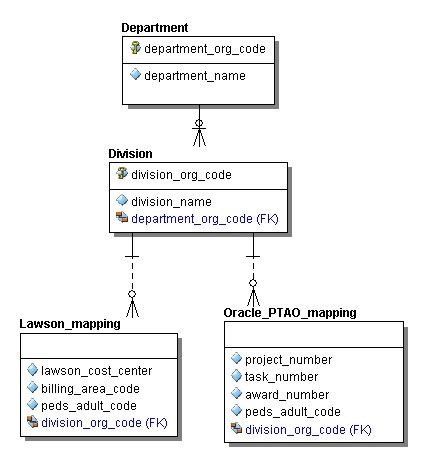
| Entity Relationship Diagram | Use at your discretion | An entity relationship (ER) model is an abstract way of describing a database. In the case of a relational database, which stores data in tables, some of the data in these tables point to data in other tables — for instance, your entry in the database could point to several entries for each of the phone numbers that are yours. The ER model would say that you are an entity, and each phone number is an entity, and the relationship between you and the phone number is "has a phone number." Diagrams created to design these entities and relationships are called entity relationship diagrams. | 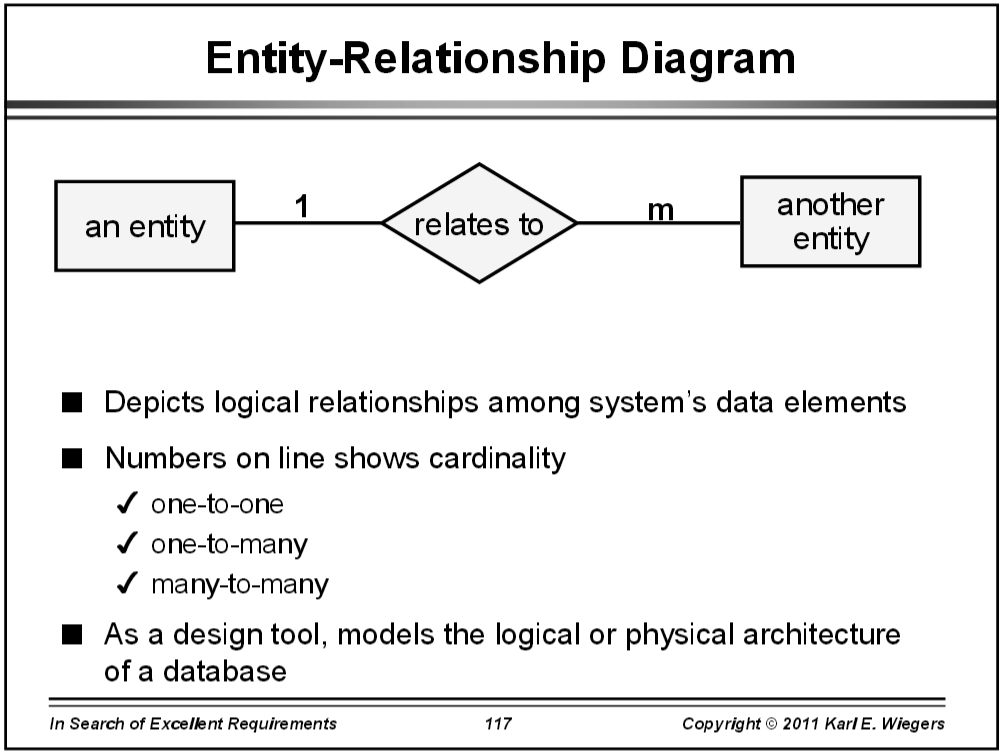 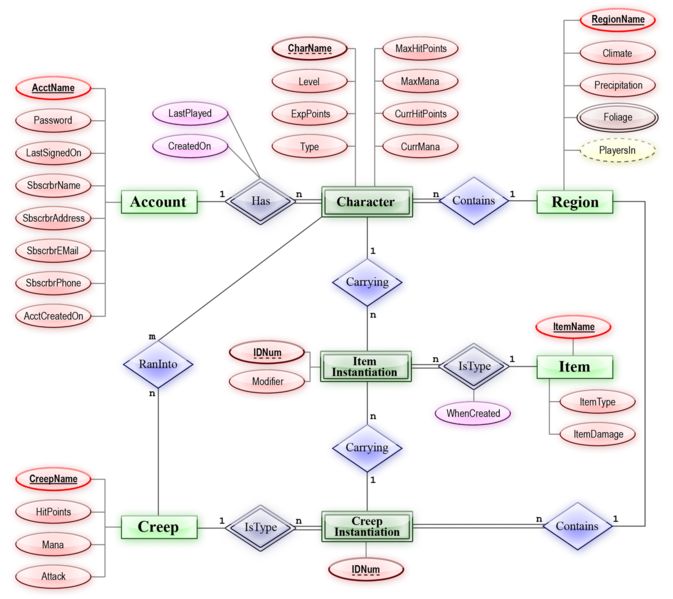 Wikipedia: Entity-relationship Model (external link) |
 |
| Class Diagram | Use at your discretion | In software engineering, a class diagram in the Unified Modeling Language is a type of static structure diagram that describes the structure of a system by showing the system's classes, their attributes, operations (or methods) and the relationships among objects. | 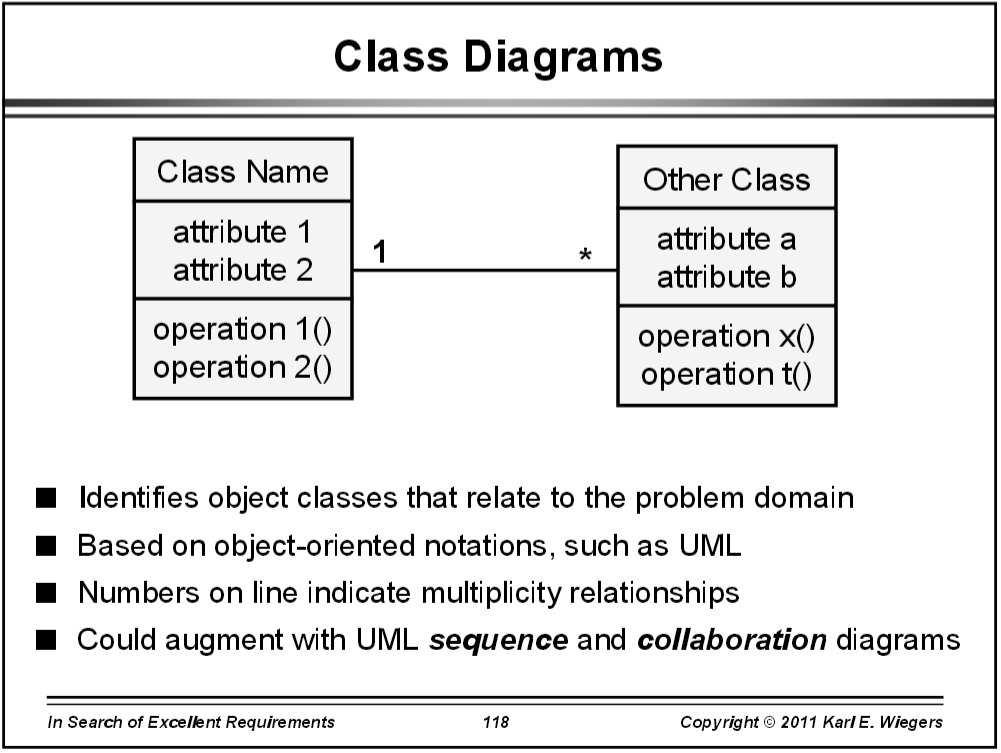 Wikipedia: Class Diagram (external link) |
No Stanford Class Diagram Examples Available |
| State Transition Diagram | Use at your discretion | A state diagram is a type of diagram used in computer science and related fields to describe the behavior of systems. State diagrams require that the system described is composed of a finite number of states' sometimes, this is indeed the case, while at other times this is a reasonable abstraction. Many forms of state diagrams exist which differ slightly and have different semantics. | 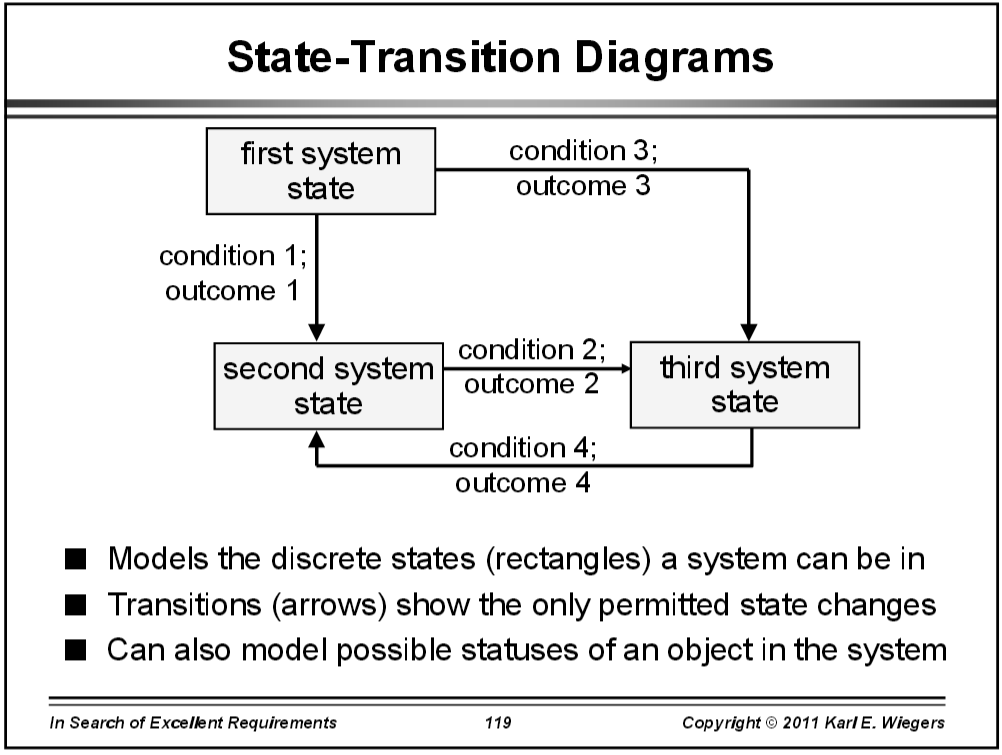 Wikipedia: State Diagram (external link) |
 |
| Dialog Map | Use at your discretion | Dialog mapping is a software-assisted method of non-linear group facilitation, initially developed by Jeff Conklin. It allows participants to offer their contributions to the conversation in an organic, dialogical flow, while the facilitator maps their contribution onto an organized logic tree that is being seen by all. | 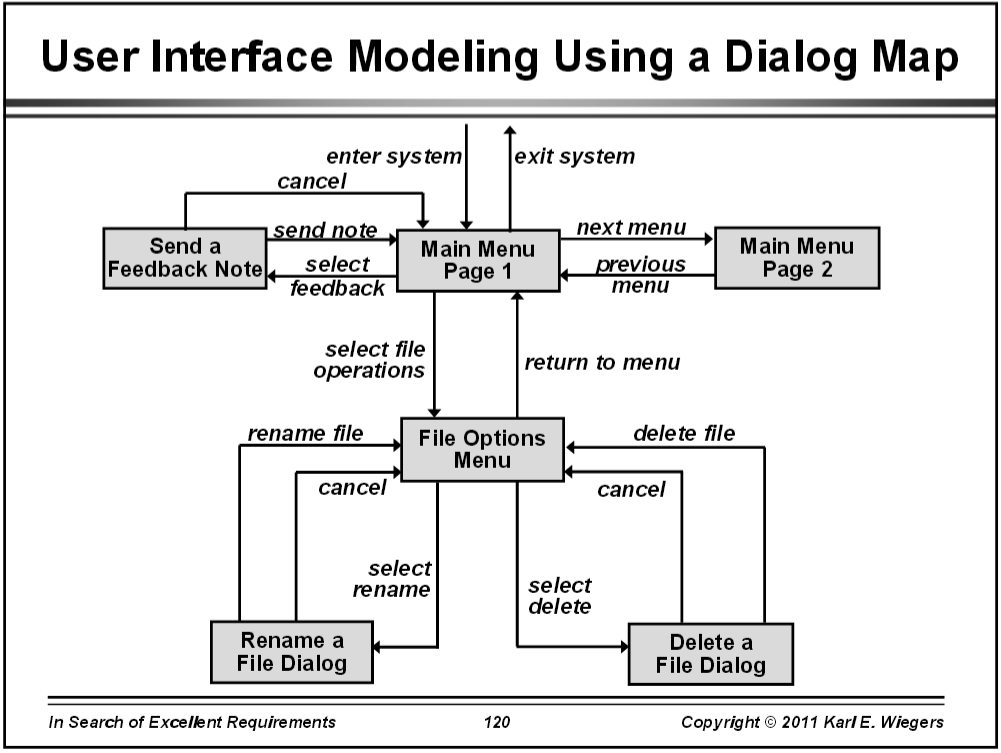 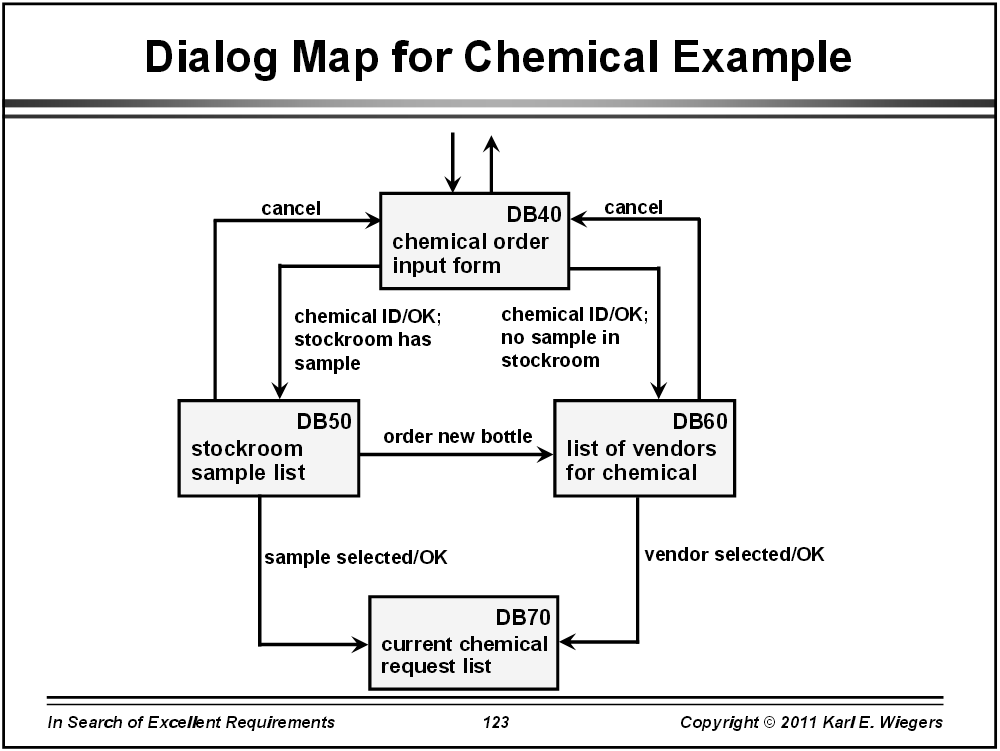 No Wikipedia page available |
Faculty Affairs Dialog Map |
| Flowchart | Use at your discretion | A flowchart is a type of diagram that represents an algorithm or process, showing the steps as boxes of various kinds, and their order by connecting them with arrows. This diagrammatic representation illustrates a solution to a given problem. Process operations are represented in these boxes and arrows; they are implied by the sequencing of operations. Flowcharts are used in analyzing, designing, documenting, or managing a process or program in various fields. | Wikipedia: Flowchart (external link) | No Stanford Flowchart Examples Available |
| Decision Trees and Tables | Use at your discretion |
A decision tree is a decision support tool that uses a tree-like graph or model of decisions and their possible consequences, including outcomes, resource costs, and utility. It is one way to display an algorithm. Decision trees are commonly used in operations research, specifically in decision analysis, to help identify a strategy most likely to reach a goal. Decision tables are a precise yet compact way to model complicated logic. Decision tables, like flowcharts and if-then-else and switch-case statements, associate conditions with actions to perform, but in many cases do so in a more elegant way. |
Wikipedia: Decision Tree (external link) | FASTFAC Decision Tree Example |
| Fishbone Diagram | Use at your discretion | Ishikawa diagrams (also called fishbone diagrams, herringbone diagrams, cause-and-effect diagrams, or Fishikawa) are casual diagrams created by Kaoru Ishikawa (1965) that show the causes of a specific event. Common uses of the Ishikawa diagram are product design and quality defect prevention, to identify potential factors causing an overall effect. Each cause or reason for imperfection is a source of variation. Causes are usually grouped into major categories to identify these sources of variation. The categories typically include:
|
Wikipedia: Ishikawa Diagram (external link) | No Stanford Fishbone Diagram Examples Available |
| Storyboards and Scenario Modeling | Use at your discretion | Storyboards are graphic organizers in the form of illustrations or images displayed in sequence for the purpose of pre-visualizing a motion picture, animation, motion graphic, or interactive media sequence. | Wikipedia: Storyboard (external link) scenario modeling (external link) |
No Stanford Storyboard Examples Available |
| Functional Decomposition | Use at your discretion | Functional decomposition refers broadly to the process of resolving a functional relationship into its constituent parts in such a way that the original function can be reconstructed (i.e., recomposed) from those parts by function composition. In general, this process of decomposition is undertaken either for the purpose of gaining insight into the identity of the constituent components (which may reflect individual physical processes of interests, for example), or for the purpose of obtaining a compressed representation of the global function, a task which is feasible only when the constituent processes possess a certain level of modularity (i.e., independence or non-interaction). Interactions between the components are critical to the function of the collection. All interaction may not be observable, but possibly deduced through repetitive perception, synthesis, validation, and verification of composite behavior. | Wikipedia: Functional Decomposition (external link) |  |