Splunk: Find Your Data and Make Sense of It
Splunk is about to get better. If you’re already using it you should know that University IT (UIT) is upgrading to the NextGen Splunk environment to enhance security controls, differentiate between operating system and application log files, and compile all log files into an easy to report format.
Splunk captures all of the information from all of your servers, analyzes that data, and presents the information in charts and graphs that make it easy for you to read and understand. Splunk can even be set up to send alerts when there is a problem or when something in the data matches any criteria that you have set. Splunk is the primary centralized logging system used at the university. If you aren't using Splunk, you might consider how it can help you.
Migrating to NextGen Splunk
The current version of Splunk, which has been in place for more than five years, will no longer accept any log files after Aug. 31, 2018. The UIT Splunk Solutions team will contact departments who are currently sending logs to the legacy Splunk environment to help ensure a smooth transition to the NextGen Splunk environment.
Detailed instructions for migrating your servers from the legacy Splunk environment to the NextGen Splunk environment are available on the Centralized Logging website.
About Splunk
Servers and applications generate large volumes of data every day. And, while all of this information is captured by the server, it can be hard to compile and get meaning from it, especially when the data is spread across multiple servers, and throughout a variety of software applications.
Do you want information about how many people are interacting with your website? Splunk can help. Do you want to know how often users are failing to login successfully to your website? Splunk can help.
For system administrators, Splunk provides a wide variety of important information to help manage servers, including:
- Operating system and application logs analyzed and reported in one place
- Logs and reports saved in Splunk, freeing up network storage needs for departments
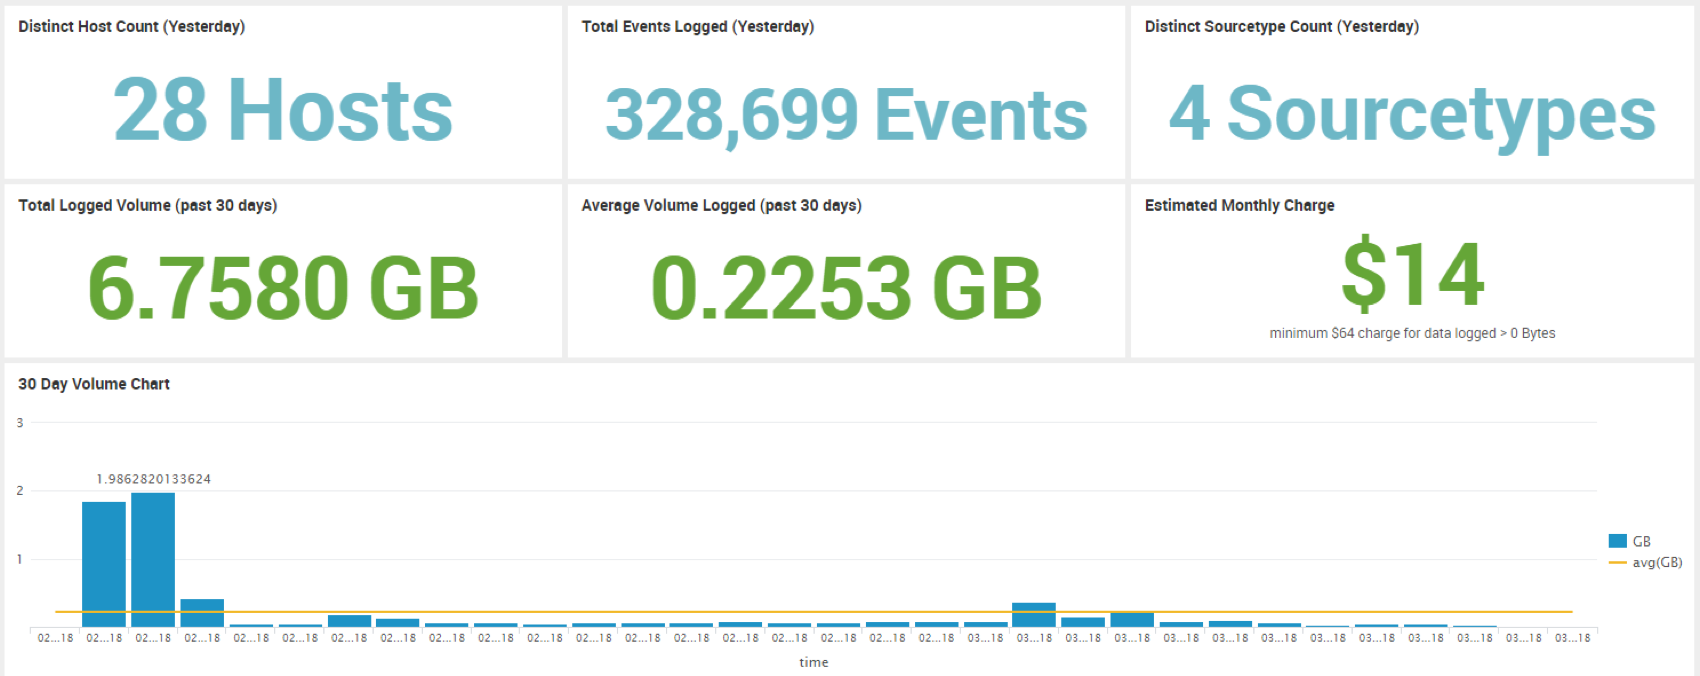
- Dashboards of key server metrics provided in a single window pane
- Alerts when key patches are not applied
Below is a sample dashboard from one of the departments using Splunk to capture and analyze data.
Learn more
If you are interested in attending training to learn more about the NextGen Splunk environment, send email to Sreenivas Konduru and ask to be added to the Splunk users email list, where future training opportunities will be announced.
You can learn more about Splunk by visiting the Centralized Logging website.
If you have questions or would like to use Splunk to collect and analyze data for your work, please submit a Help ticket.
DISCLAIMER: UIT News is accurate on the publication date. We do not update information in past news items. We do make every effort to keep our service information pages up-to-date. Please search our service pages at uit.stanford.edu/search.